 Sujaag
01 / SUJAAG DASHBOARD
Available nowYour operation.
Connected in one view.
Bring surveillance events, camera and server health, connected device readings, and operational reports into a shared browser-based workspace.
Built for control rooms, system administrators, integrators, and the teams responsible for keeping a site running.
Book a Dashboard walkthrough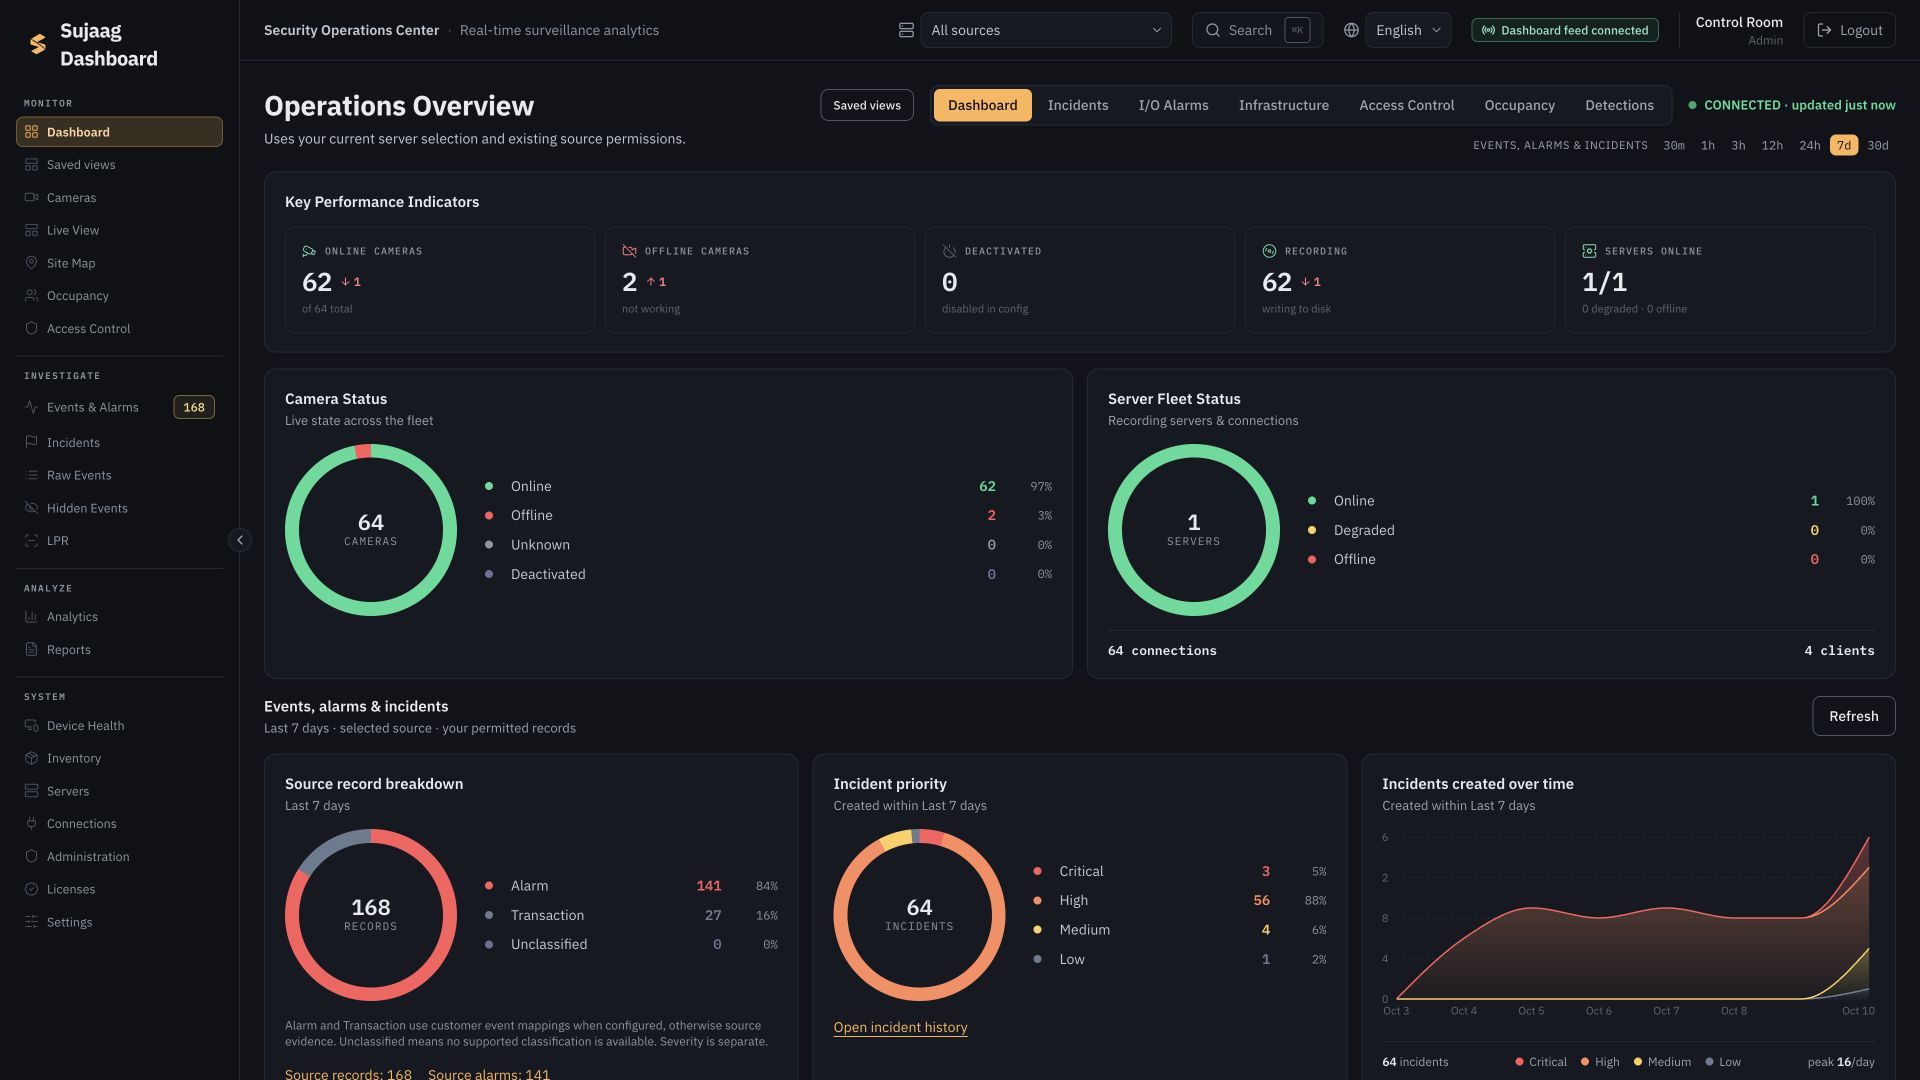
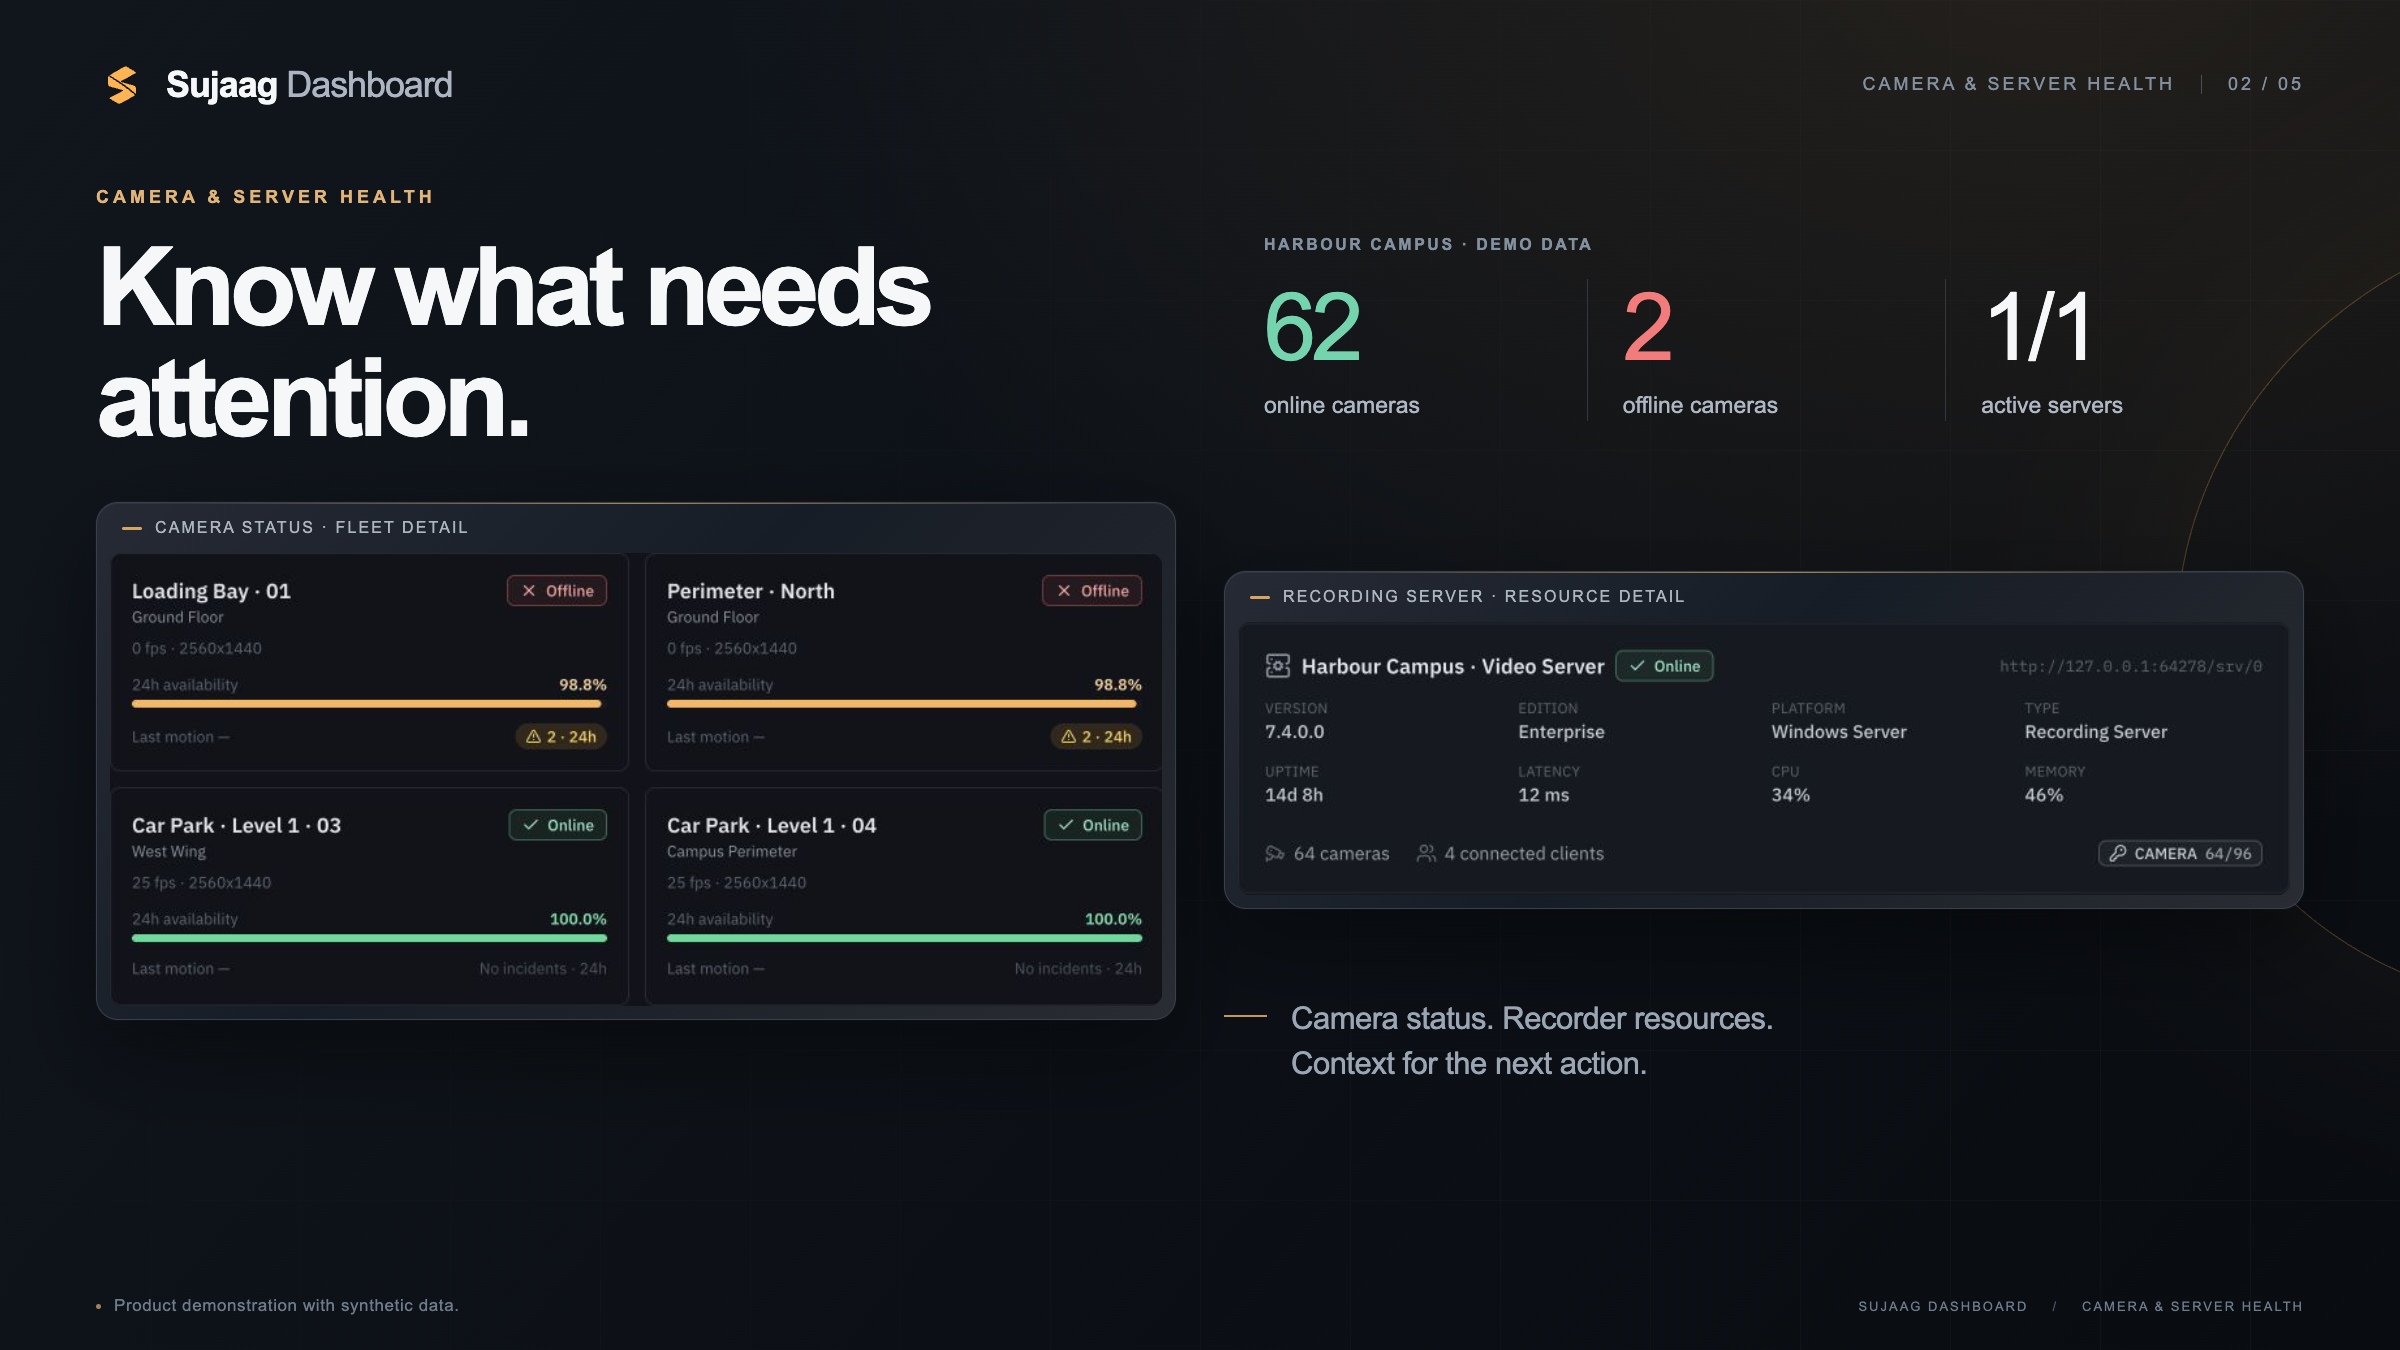
Know what needs attention.
Review recording state, outages, availability history, and source freshness. Unknown and stale information stays visible.
Find the source behind an event.
Filter original source records by asset, time, severity, and record kind, then open the details for context.
Turn activity into a clearer picture.
Review operational trends and prepare reports across incidents, occupancy, detections, audit logs, and licence plates.
CAMERA, SERVER & DEVICE HEALTH
See beyond
the camera count.
Move from the fleet overview to individual cameras, recorder resources, and connected infrastructure. Status filters and availability history help your team focus on the devices that need attention.
- Camera inventory, recording state, and current outages
- Server health and available resource readings
- Device readings, source inventory, and configuration changes
SOURCE EVENTS & INVESTIGATION
Follow the event.
Keep the context.
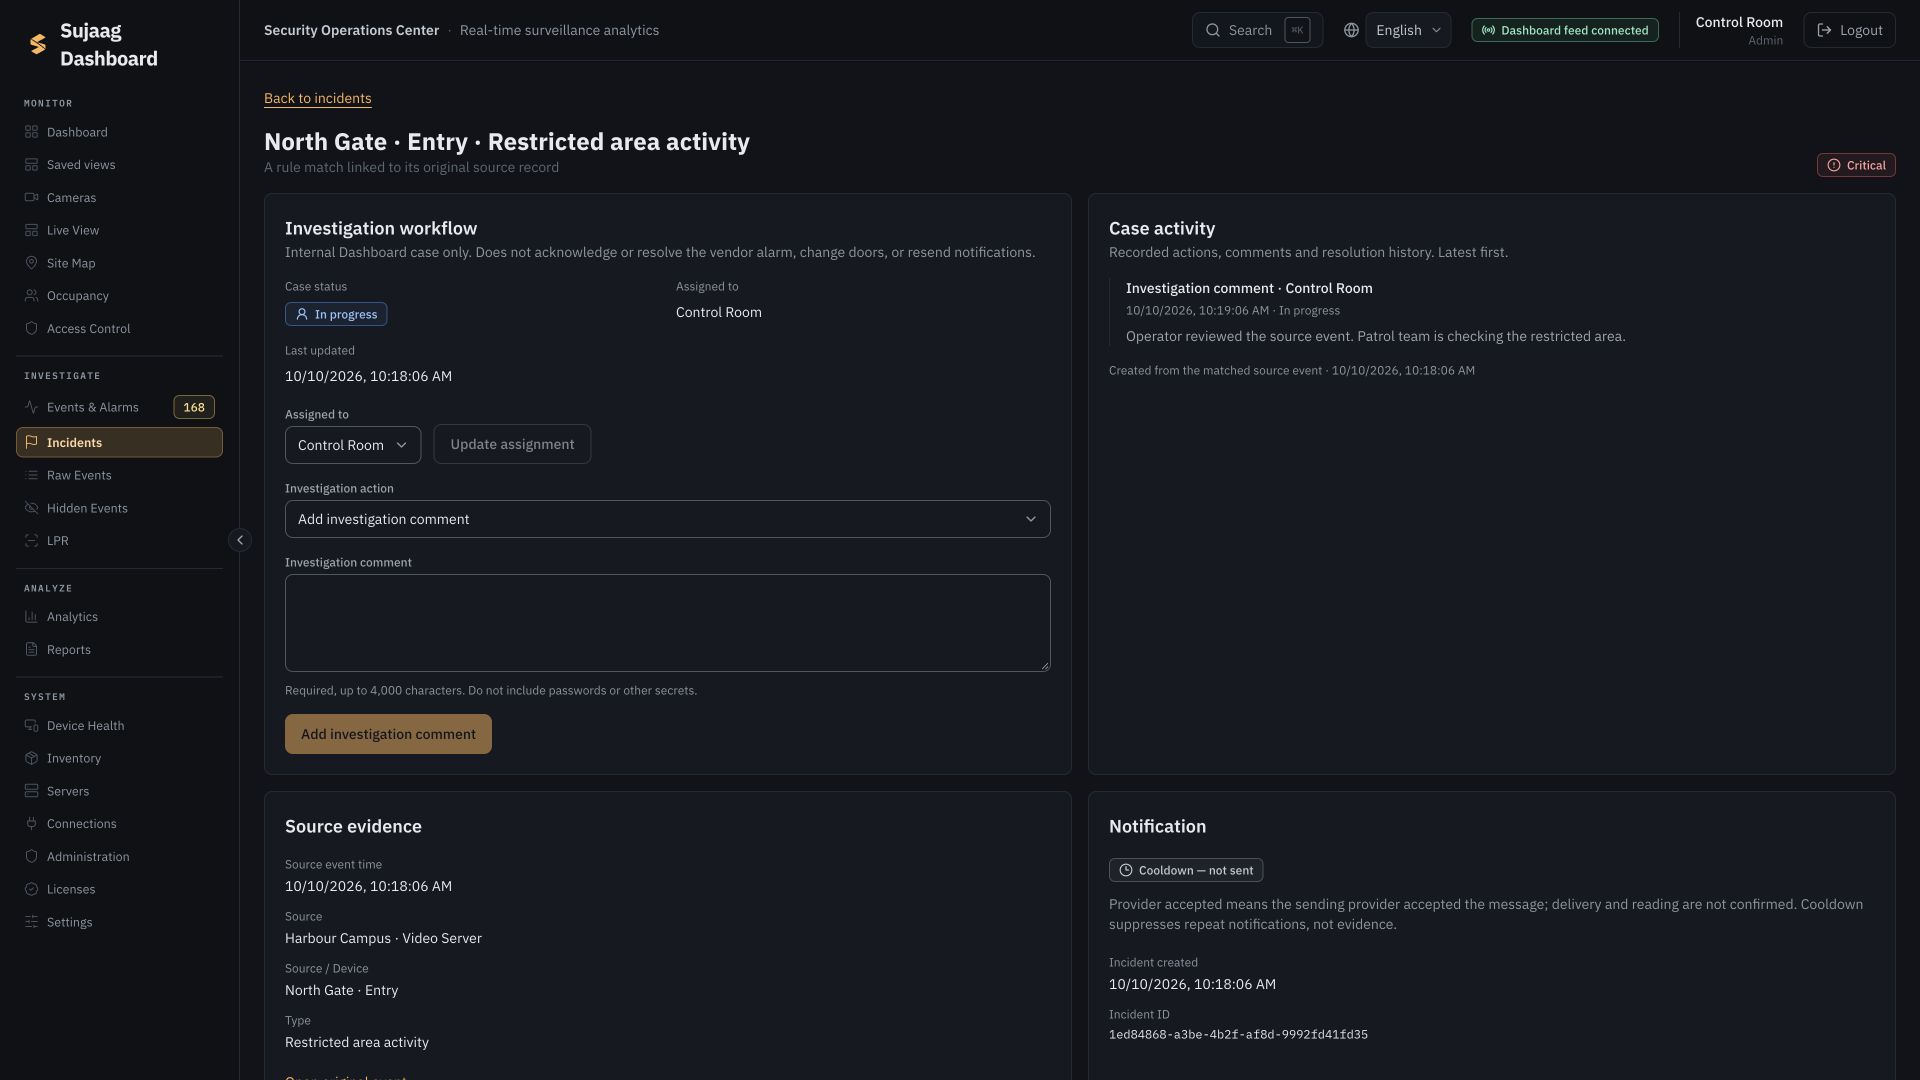
Bring original source records and rule-generated incident summaries into your operational view. Explore event details and linked still evidence when the source provides it.
- Source, asset, time, severity, and record-kind filters
- Separate source history and rule-generated incidents
- Context for investigation across connected sources
Shown: a demonstration of the internal case workflow. Available workflows depend on your deployment; internal case actions are separate from source-system alarm controls.
 View image in detail
OPERATIONAL REPORTING
From daily activity
to useful reports.
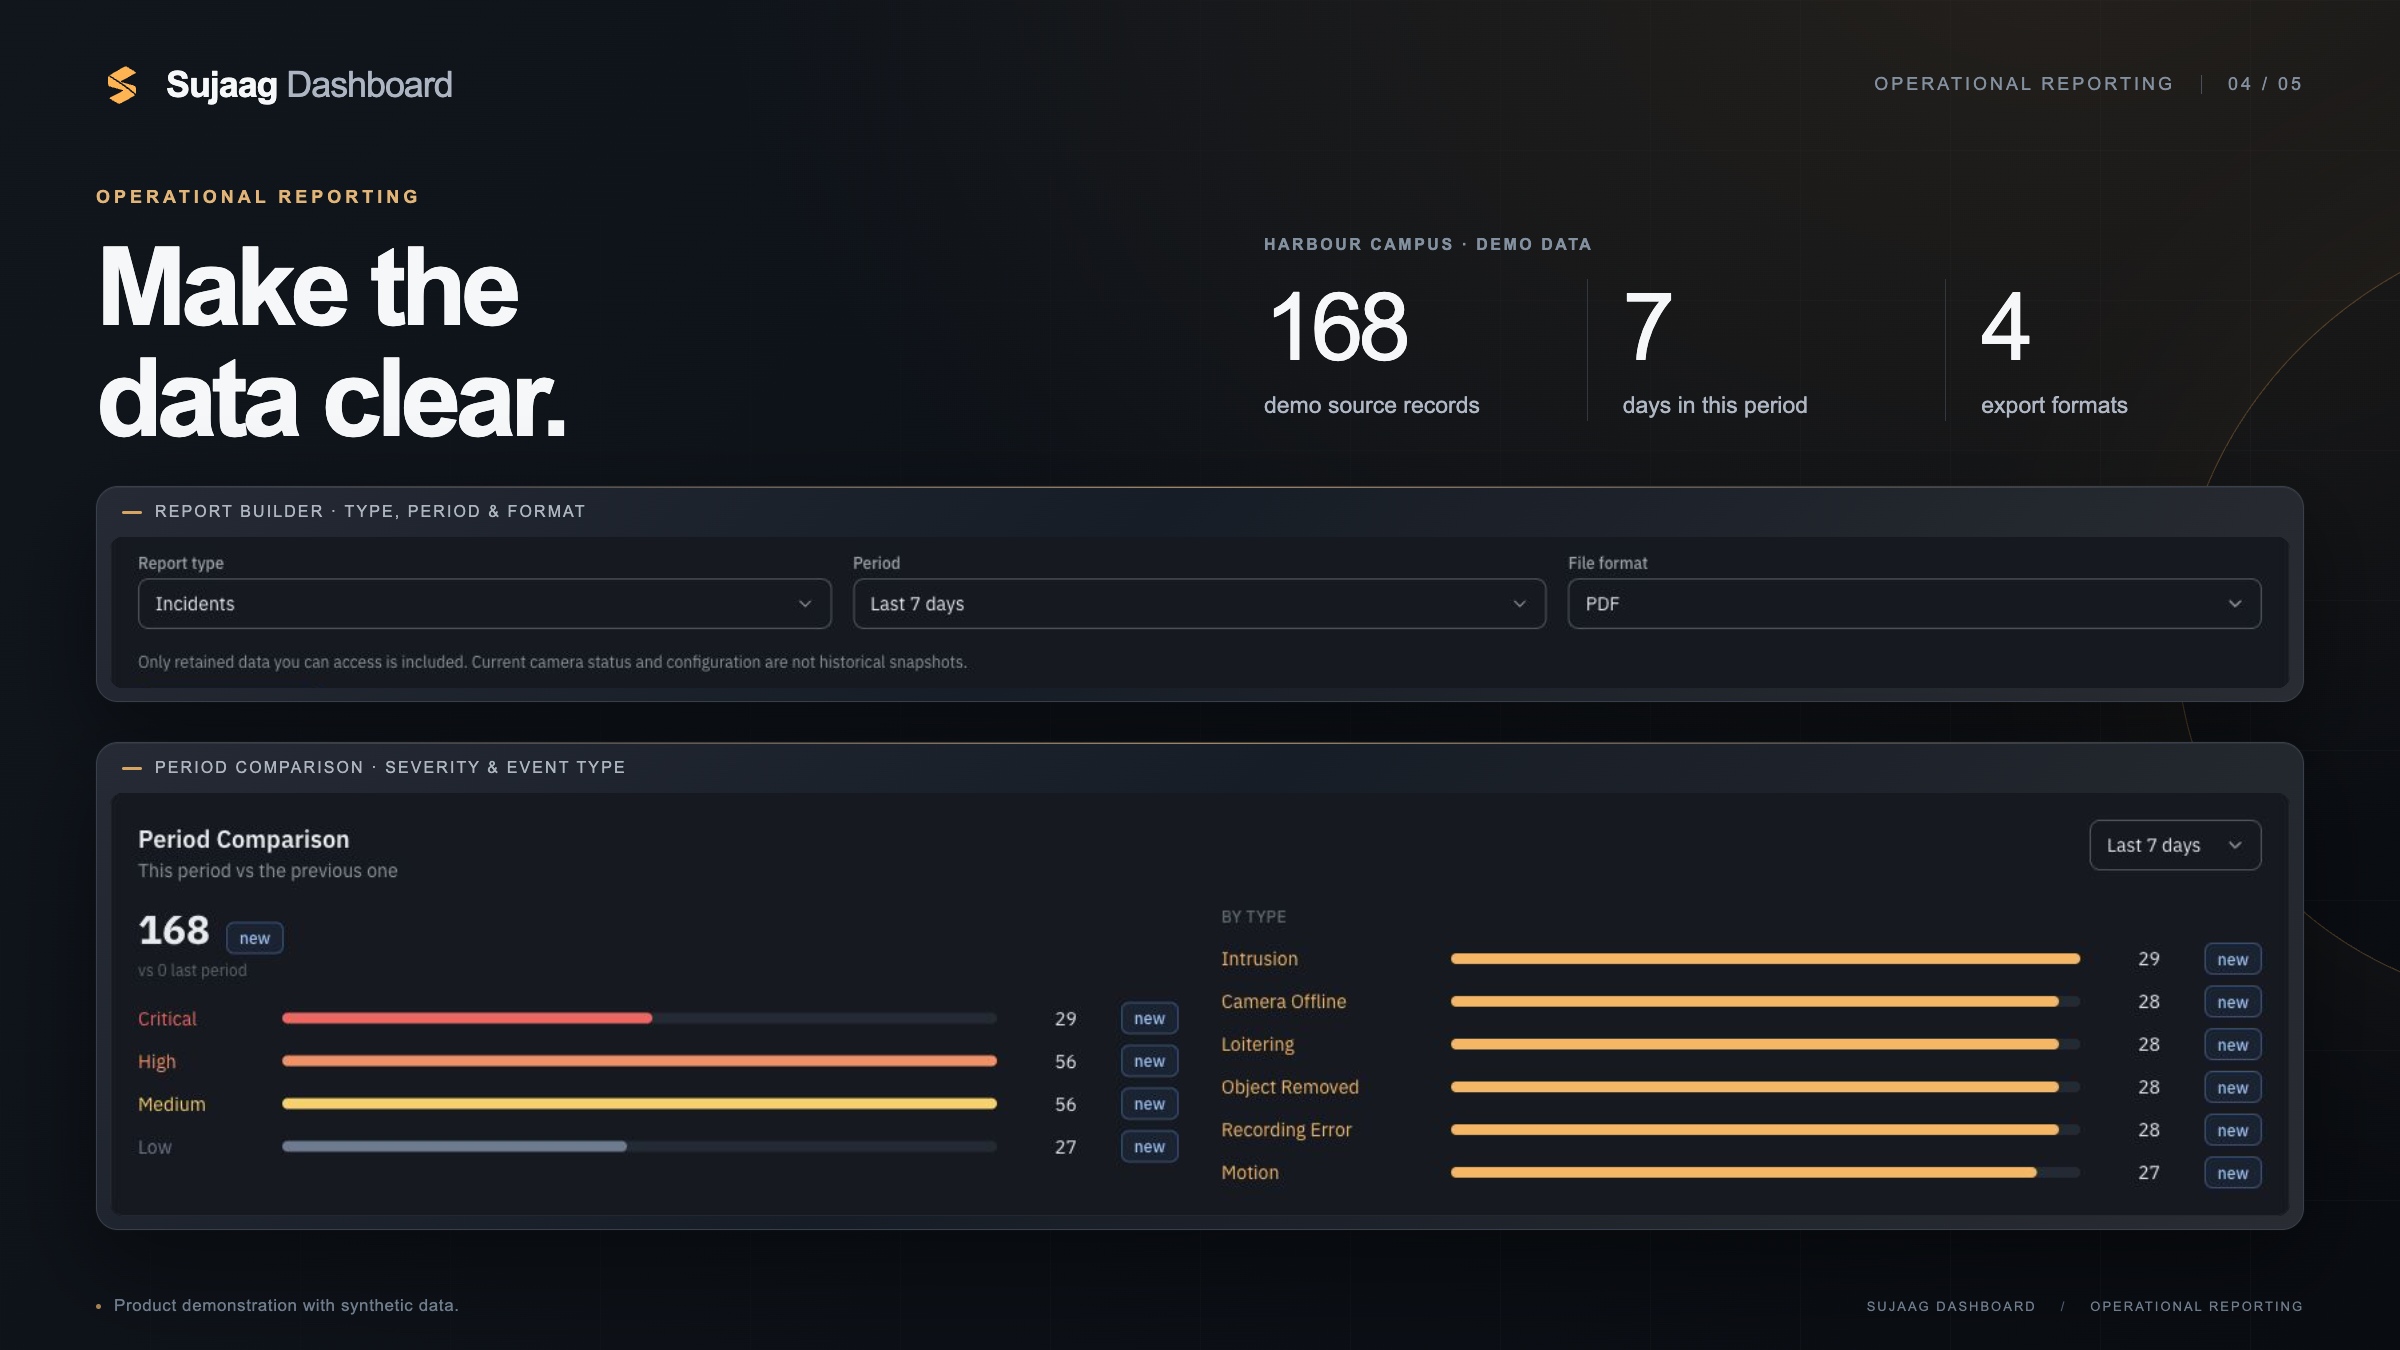
Choose the report type and period, review the results, and export the format your team needs. Configure daily, weekly, or monthly schedules for regular reporting.
- JSON, CSV, XLSX, and PDF output options
- Incidents, occupancy, detections, audit logs, and licence plates
- Local scheduled outputs; email with configured SMTP
Report content depends on connected sources, retained data, permissions, and licensed scope.
CONFIGURED INTEGRATIONS
Connect surveillance
and infrastructure.
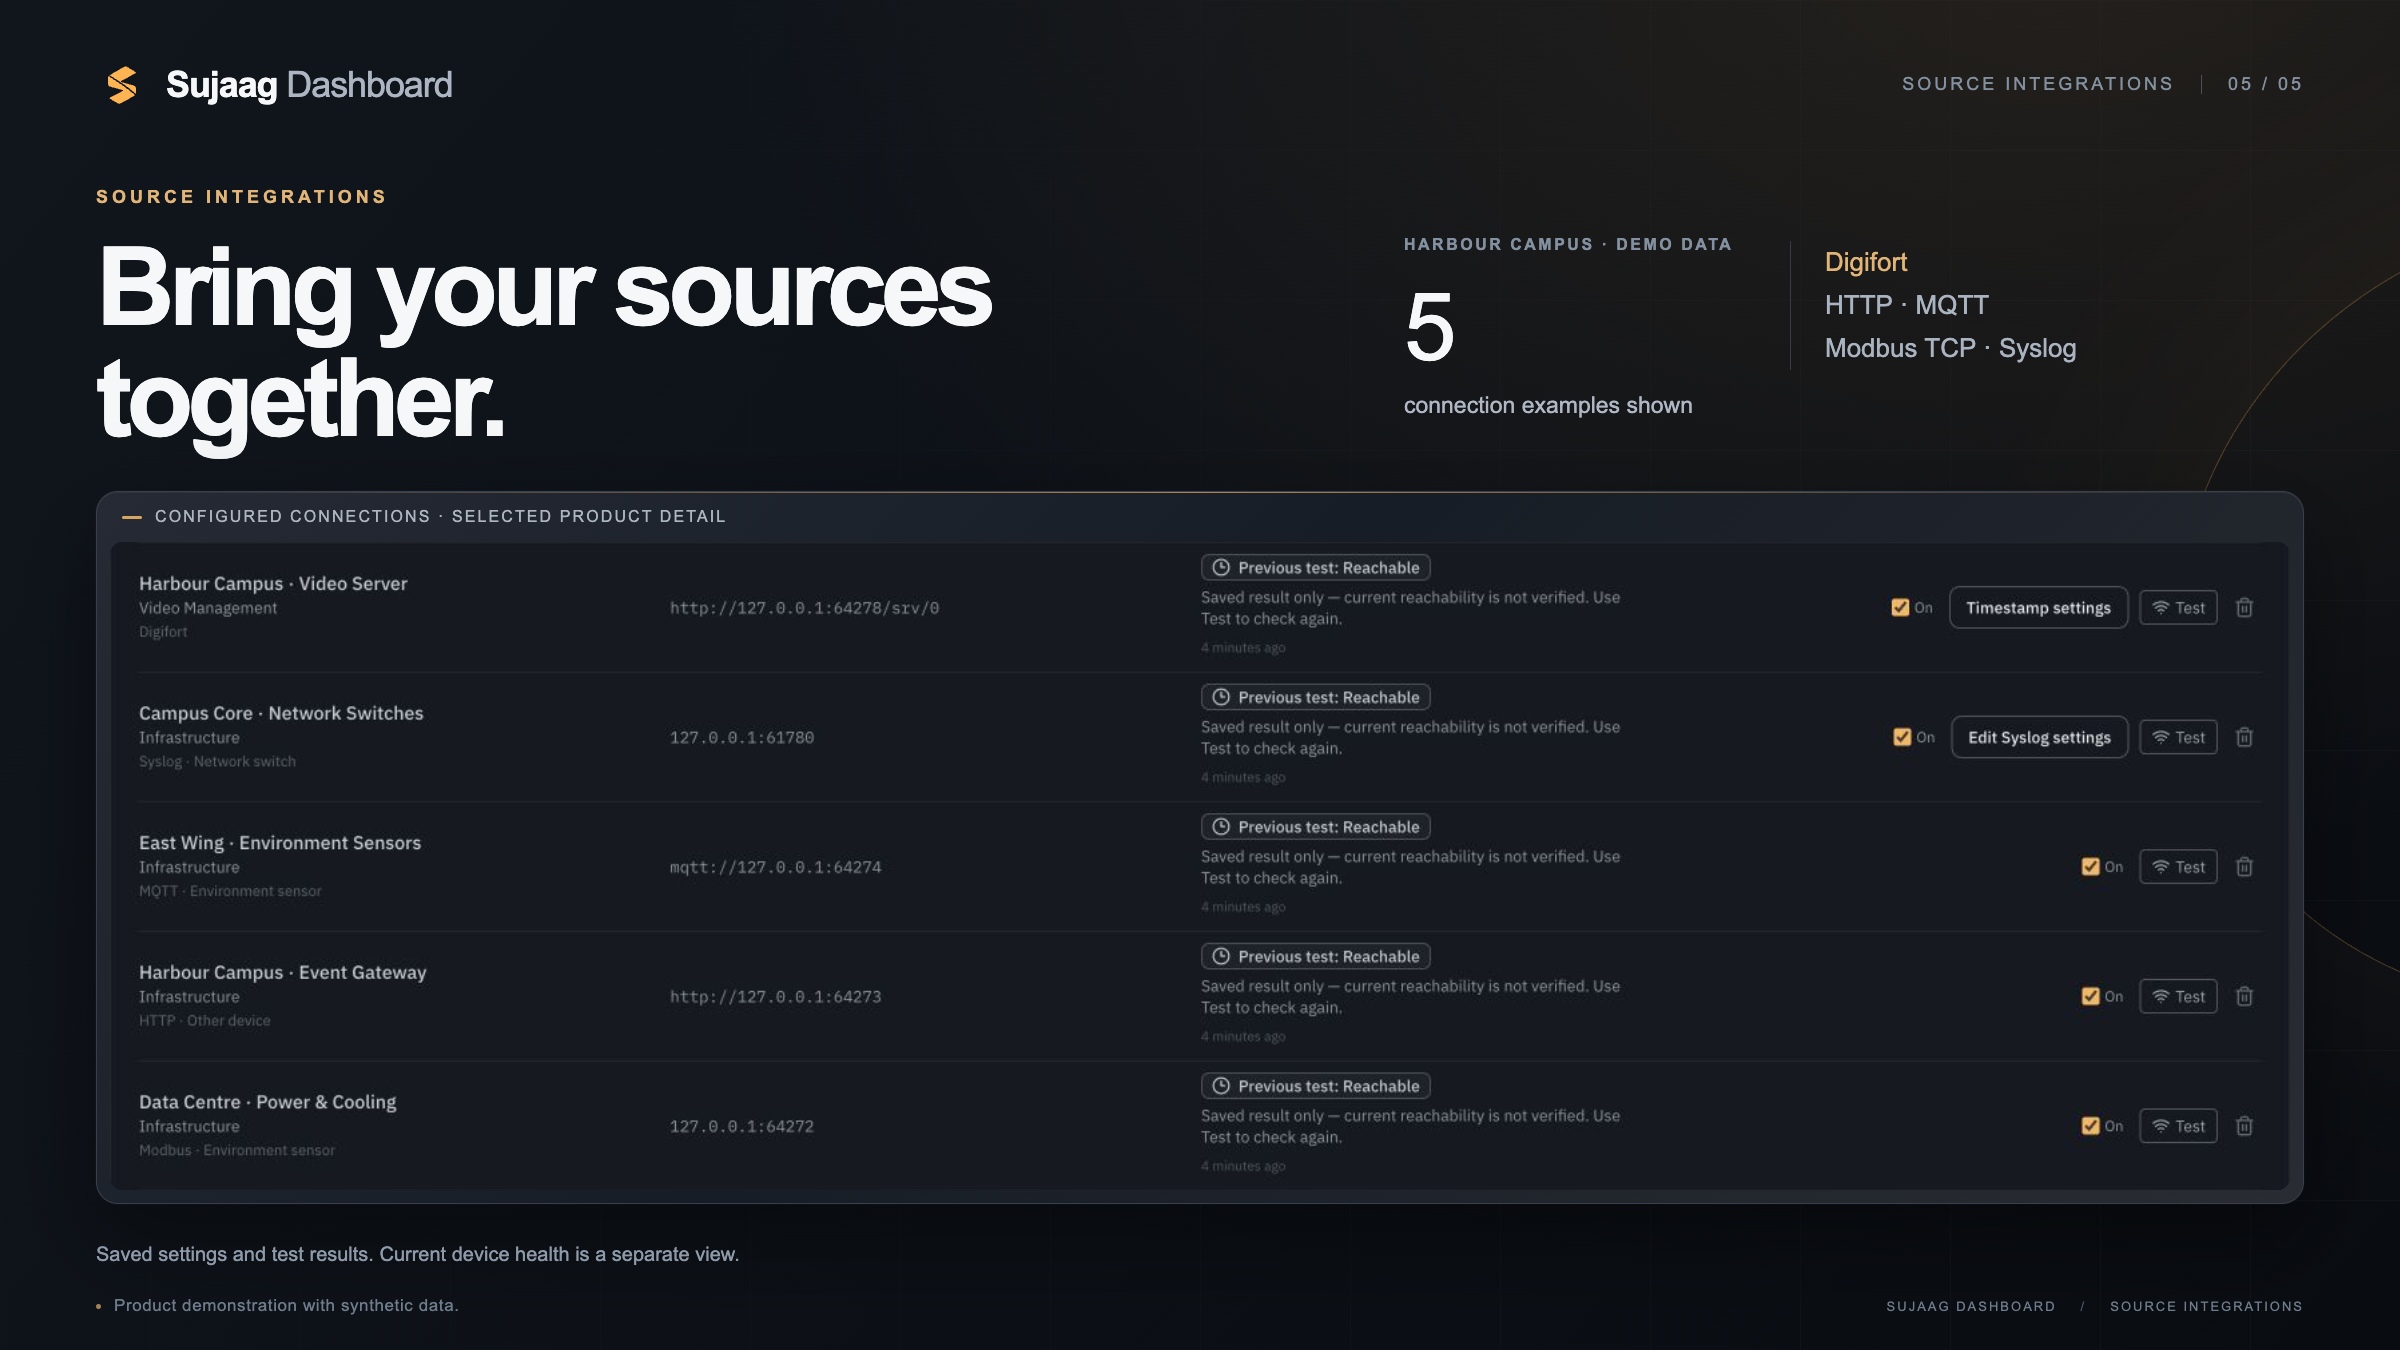
Connect surveillance and infrastructure through adapters configured for your environment.
THE CORE / LOCAL BY DESIGN
Connected sources.
A shared operational workspace.
Your sources
Surveillance servers, device protocols, and configured event feeds.
Local collection & storage
Source records and device readings collected into the local deployment.
Your workspace
Overview, history, investigation, and reporting in the browser.
On your local network
Local functions can operate without an internet connection. Connected sources and optional email or webhook services need their configured network access.
Access for each role
Admin, analyst, and viewer roles, resource access controls, and tenant-scoped database policies help define who can see what.
Protected connector credentials
Stored connector credentials use AES-256-GCM encryption. HTTPS is configured through deployment TLS or a reverse proxy.
English & Arabic
A bilingual interface with right-to-left support helps teams work in their preferred language.
LET’S FIND YOUR STARTING POINT
Find the right product
for your operation.
Tell us about your environment. We’ll help you explore the right product.
Talk to the team